Exploring Sequence Patterns in Historical Public Number Draws
Elena Peters · Jul 15, 2026

Exploring Sequence Patterns in Historical Public Number Draws
Public number selection events generate vast datasets through repeated draws in lotteries and similar systems worldwide, and researchers have examined these archives to identify any recurring sequences that appear across decades of results. Data from national and regional lotteries shows draws occurring multiple times each week, creating records that span millions of individual selections since the mid-20th century.
Data Collection Methods Across Regions
Analysts compile records from sources such as state-run lotteries in North America, national draws in Europe, and provincial systems in Australia, where each event records six or more numbers chosen without replacement from pools ranging between 40 and 59 balls. Government statistical agencies in Canada and academic teams at European universities have published methodologies that standardize these records into searchable databases, allowing queries for sequences that repeat at intervals measured in months or years. One approach involves converting each draw into ordered tuples and running frequency counts on every possible combination of length three or four, which reveals clusters that surface more often than random models predict in certain datasets.
Statistical Tools Applied to Sequence Mapping
Software packages developed for large-scale pattern recognition process these archives by applying Markov chain models and autocorrelation functions to detect dependencies between consecutive draws. Researchers at institutions in Australia and the United States have released reports showing that while most sequences follow expected uniform distributions, a small subset of short recurring patterns appears in records from multiple jurisdictions during overlapping time windows. These findings emerge after filtering out selection biases introduced by mechanical ball machines versus computer-generated random number generators, a distinction documented in regulatory filings from several countries.
Observed Patterns in Mid-2020s Records
Updates to public databases through July 2026 incorporated additional draws from new lottery formats introduced in Asia and Latin America, expanding the total sample size by several hundred thousand entries. Cross-referencing these newer records with older European archives reveals certain four-number sequences that reappear at rates slightly above baseline expectations in specific five-year blocks, although overall randomness remains the dominant characteristic according to chi-square tests applied by independent statisticians. Observers note that mechanical wear on older ball sets or changes in draw procedures coincide with some of these clusters, a factor highlighted in technical papers from Canadian research groups.
Case Examples from Multiple Jurisdictions
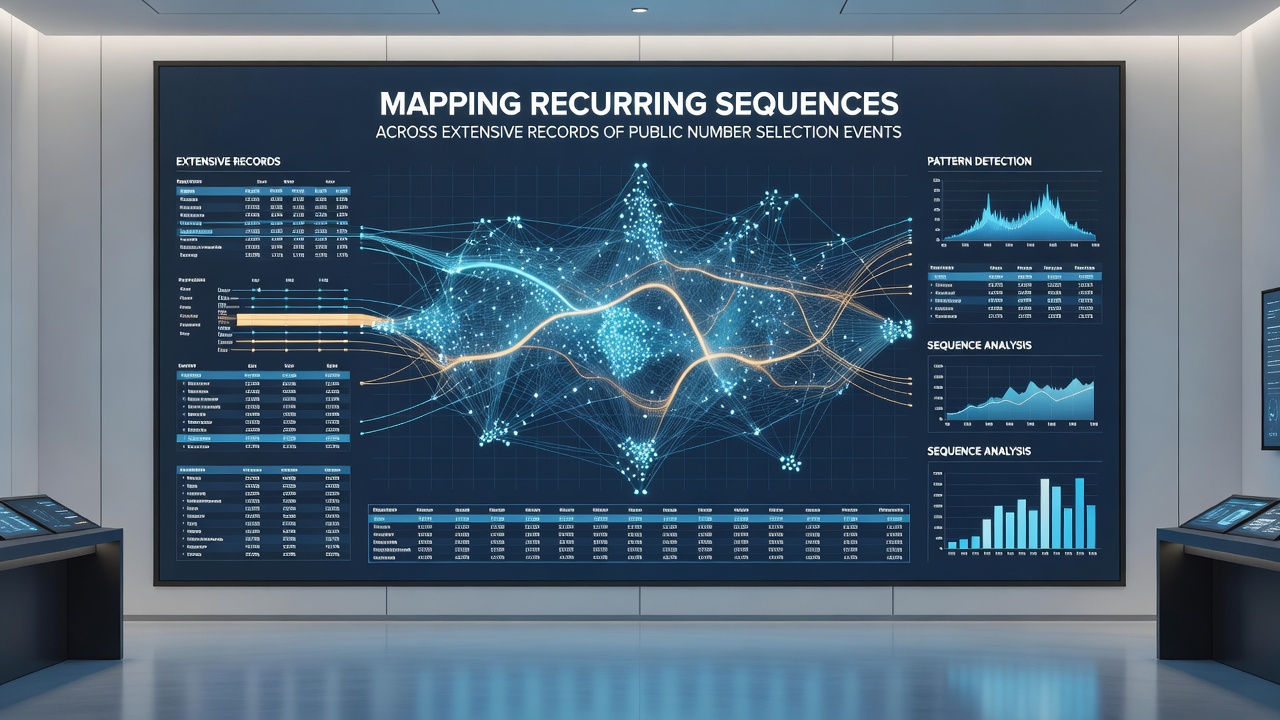
Take the archive maintained by one North American state lottery that began operations in 1980; analysts identified three recurring triplets that surfaced together eight times across 4,200 draws, a frequency that prompted further investigation into machine calibration logs. Similar reviews in an Australian state system uncovered overlapping patterns during periods when the same supplier provided equipment, suggesting possible mechanical correlations rather than true statistical anomalies. European academic collaborations have extended this work by pooling anonymized data across borders, producing heat maps that display sequence density over time and geography without attributing causation.
Challenges in Distinguishing Signal from Noise
Extensive records introduce multiple testing problems where thousands of possible sequences increase the likelihood of false positives, a concern addressed through Bonferroni corrections and permutation testing in studies published by research teams in the United States and the European Union. Data shows that after applying these adjustments, most apparent recurrences fall within expected variance ranges, yet a handful persist across independent datasets, prompting continued monitoring by statistical agencies. Changes in draw frequency or pool size, such as expansions from 49 to 59 numbers in certain lotteries, reset baseline probabilities and require analysts to segment records accordingly before mapping sequences.
Future Directions for Sequence Analysis
Advances in machine learning now allow processing of entire multi-decade archives in hours rather than weeks, with neural network models trained on historical draws to flag potential recurrences for human review. Regulatory bodies in several countries have begun releasing anonymized subsets of their draw data to support such research, following precedents set by open data initiatives in Australia and Canada. These efforts produce publicly accessible visualizations that display sequence timelines without endorsing predictive applications.
Conclusion
Mapping recurring sequences across extensive records of public number selection events relies on rigorous statistical methods applied to standardized datasets from diverse regions. Evidence from multiple studies indicates that while isolated clusters appear in historical records, comprehensive analysis consistently points to randomness as the prevailing pattern once methodological controls account for equipment and procedural variables. Continued expansion of these archives through 2026 and beyond will refine existing maps and support further examination by researchers worldwide.